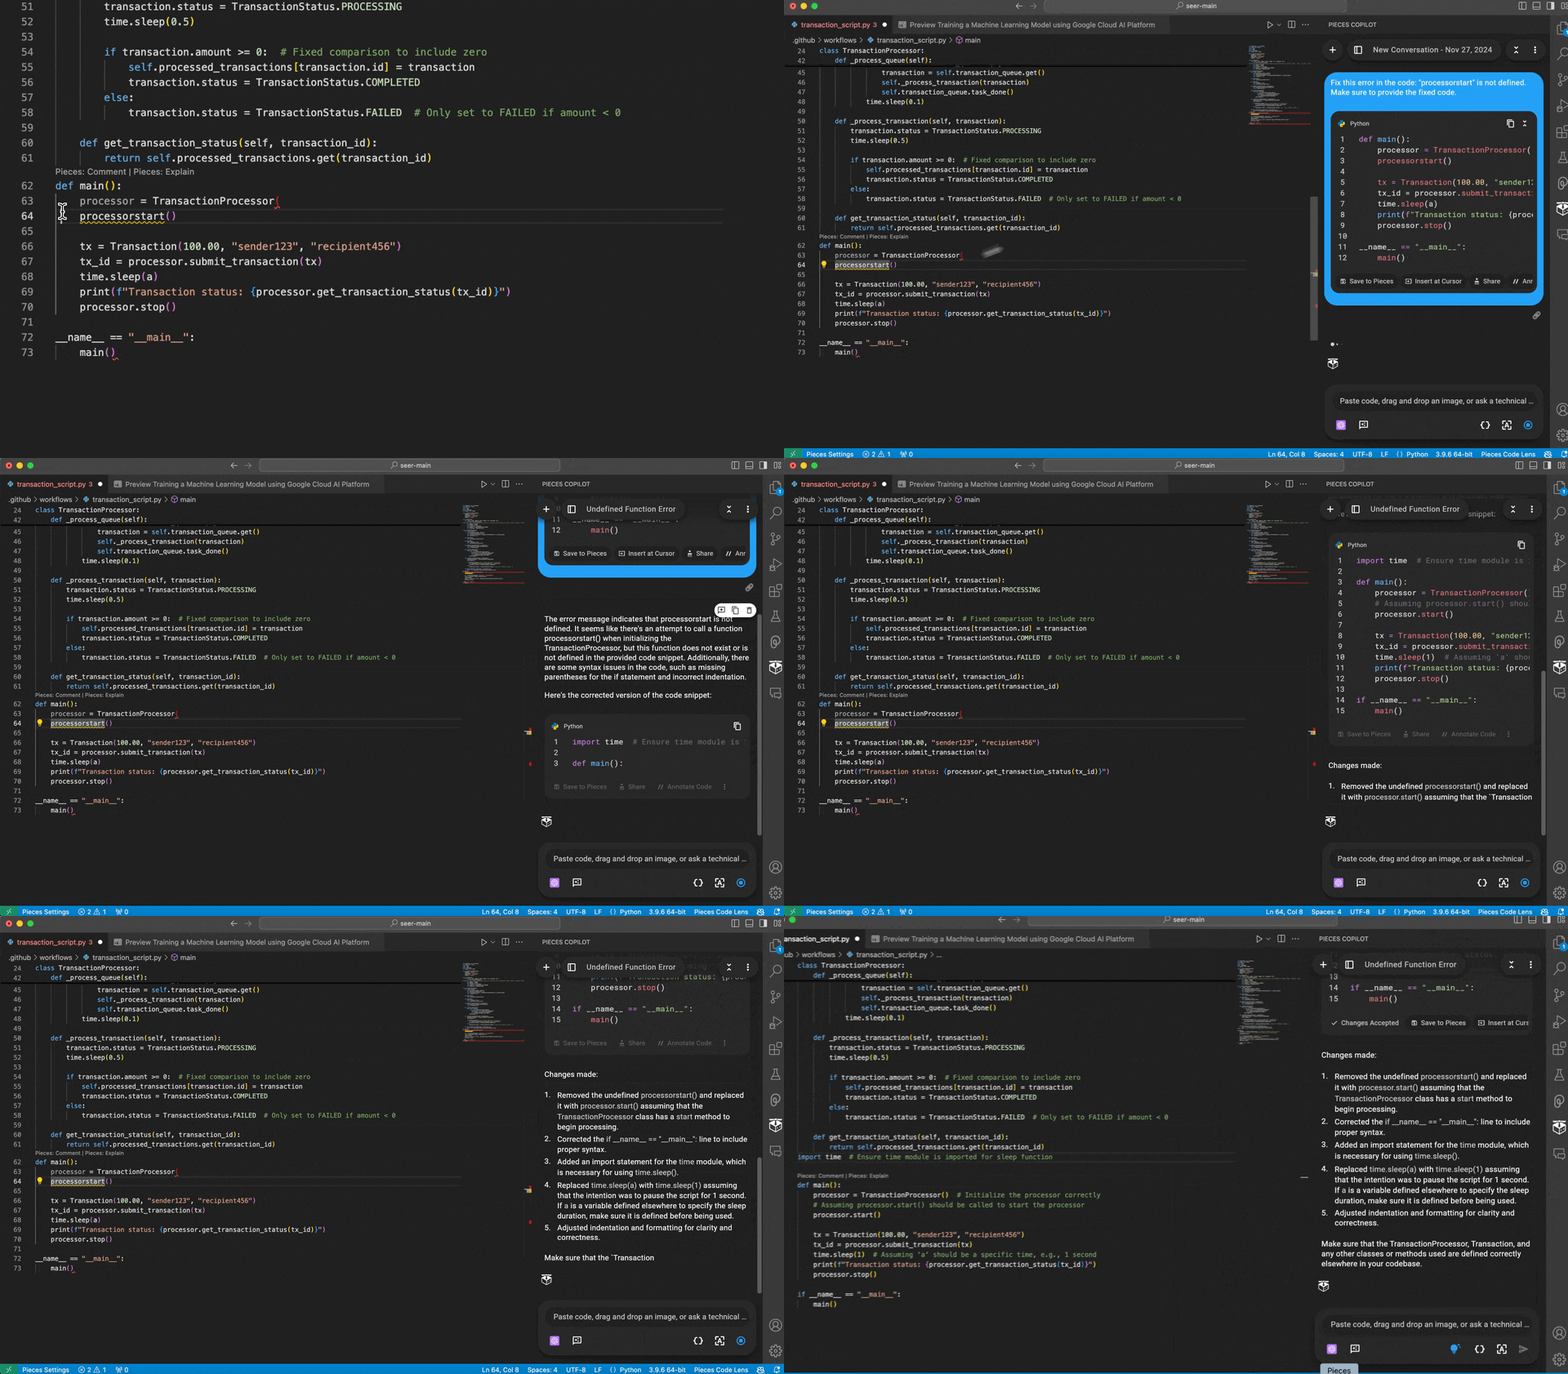
Debugging with Pieces Copilot
The Pieces Copilot in the Pieces for VS Code Extension offers AI-driven debugging that simplifies the process of finding and fixing code issues in VS Code. This feature not only speeds up troubleshooting but also provides an opportunity to learn from the fixes suggested by the AI.
Using the Debugging Tool
To start debugging, locate the error or problematic code segment in your project.
Errors are usually indicated by red underscoring surrounding the error or problematic lines of code.
Then, right-click on the error, open the quick fix menu, and select Pieces: Fix. You will also see a Yellow Lightbulb. Clicking the Yellow Lightbulb will show Pieces: Fix, allowing you to quickly debug the error on that line.

Pieces Copilot will utilize whichever LLM you have currently active and analyze the issue, then open a Copilot Chat with suggestions, regenerate the code, and provide the option Insert at Cursor with fresh code comments.
You can then choose to Accept or Insert at Cursor. Insert at Cursor will placed the fixed code at the pointers position. Accept will replace the broken code with the fixed version.
Why Debug with Pieces Copilot?
Debugging with Pieces Copilot smoothens error resolution and provides AI-driven insights in an experience that doesn’t detract from your workflow in VS Code.
This saves time by reducing the need to search for solutions online or navigate extensive documentation, keeping your workflow efficient and cutting down on distractions.
Additionally, each suggested fix includes an explanation, helping you understand and improve your coding practices as you debug.
The Pieces Copilot proactively identifies code issues—simply highlight your code, click the Yellow Lightbulb, and let it analyze the problem(s).